
Remote Debugging
Remote debugging allows us to debug a process running on a different system as long as we have access to the source code and the debugger port on the remote system.
Let’s try it out on a Java application. We will extract the ZIP file, add the files to Visual Studio Code by clicking on File > Open Folder, and then select the extracted NumberGame directory.
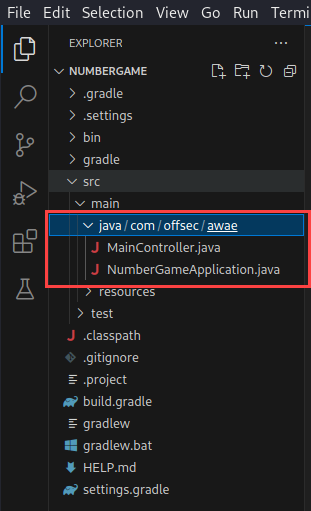
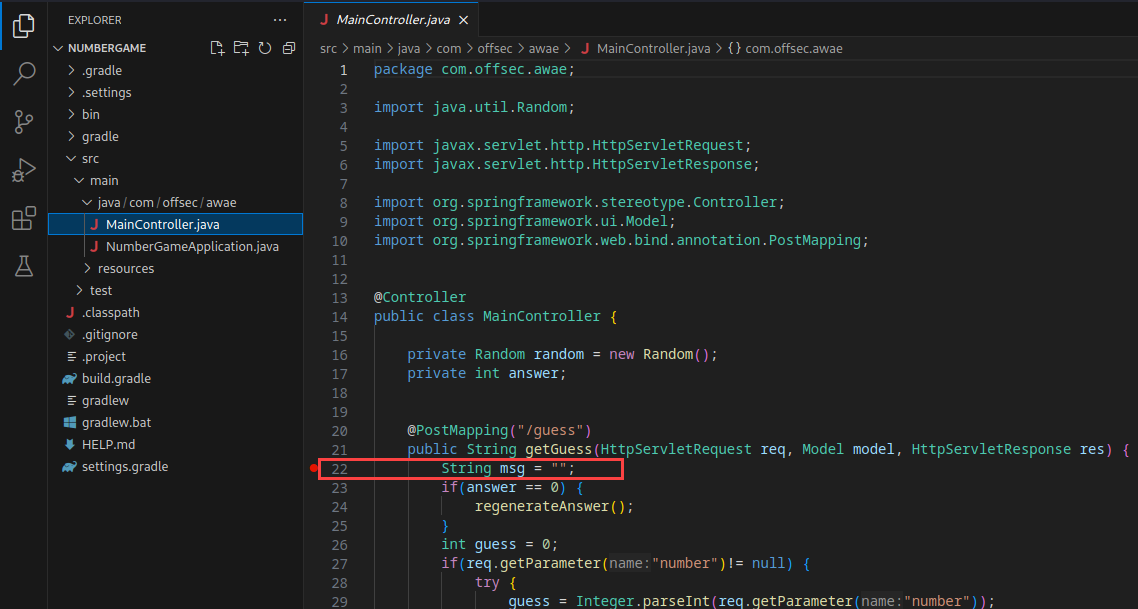
Let’s open MainController.java and set a breakpoint on line 22. Our IDE might underline some imports or objects in the file because we haven’t configured our build path. We should still be able to debug the code despite these warnings. However, if the application executes code from within a source file that we do not have, we wouldn’t be able to follow the execution into that file.
Let’s add the dependencies to VS Code. We can extract them from the JAR file. The @SpringBootApplication annotation in NumberGameApplication.java indicates this is a Spring Boot application. We can find the dependencies in /BOOT-INF/lib/ inside the JAR file. VS Code should automatically import the dependencies if we place them in a lib directory inside the NumberGame directory.
1
2
3
4
5
6
7
8
9
kali@kali:~$ unzip -j NumberGame.jar "BOOT-INF/lib/*" -d NumberGame/lib/
Archive:  NumberGame.jar
 extracting: NumberGame/lib/thymeleaf-spring5-3.0.12.RELEASE.jar
 extracting: NumberGame/lib/thymeleaf-extras-java8time-3.0.4.RELEASE.jar
 extracting: NumberGame/lib/spring-webmvc-5.3.4.jar
 extracting: NumberGame/lib/spring-web-5.3.4.jar
 extracting: NumberGame/lib/spring-boot-autoconfigure-2.4.3.jar
 extracting: NumberGame/lib/spring-boot-2.4.3.jar
...
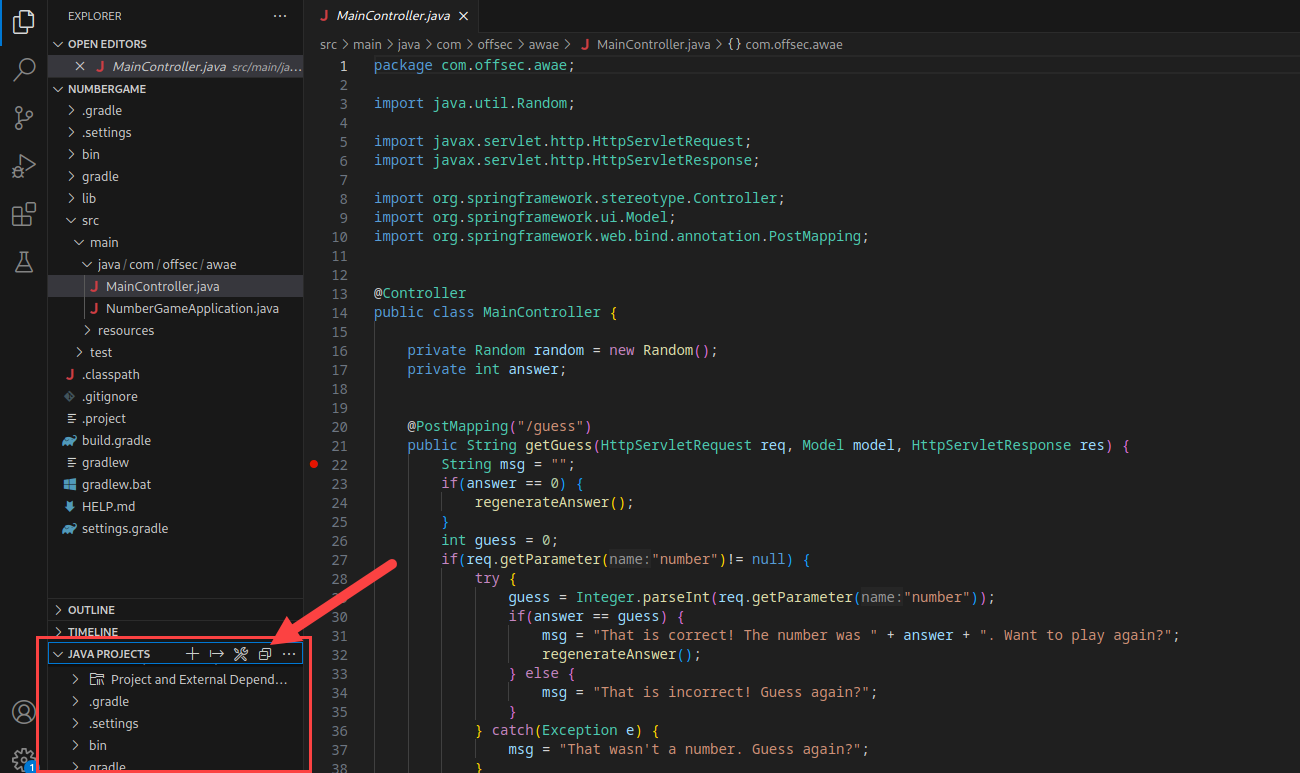
Once the dependencies are extracted, VS Code should be able to resolve all the dependencies. We can verify the dependencies were loaded properly by clicking on Java Project in the lower-left section of VS Code.
Once the Java Projects pane expands, we can click on Project and External dependencies to expand the list of dependencies and verify that the extracted JARs are listed.
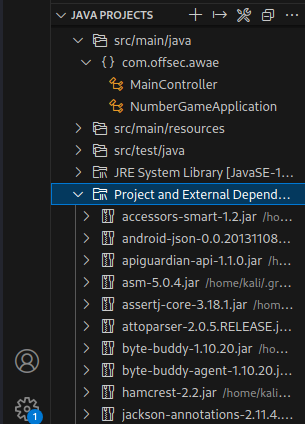
If the JAR files are not listed, we can add them manually by clicking the + button next to Project and External Dependencies and selecting them from the resulting file window.
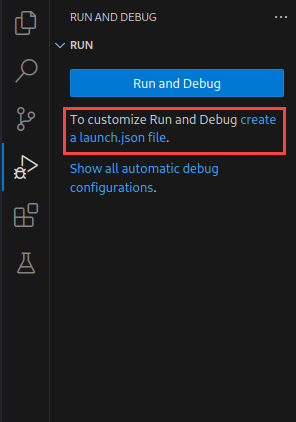
Now that we have the dependencies added, we will need a launch.json file to perform remote debugging. Visual Studio Code will create one for us if we click on the Run shortcut and then click create a launch.json file.
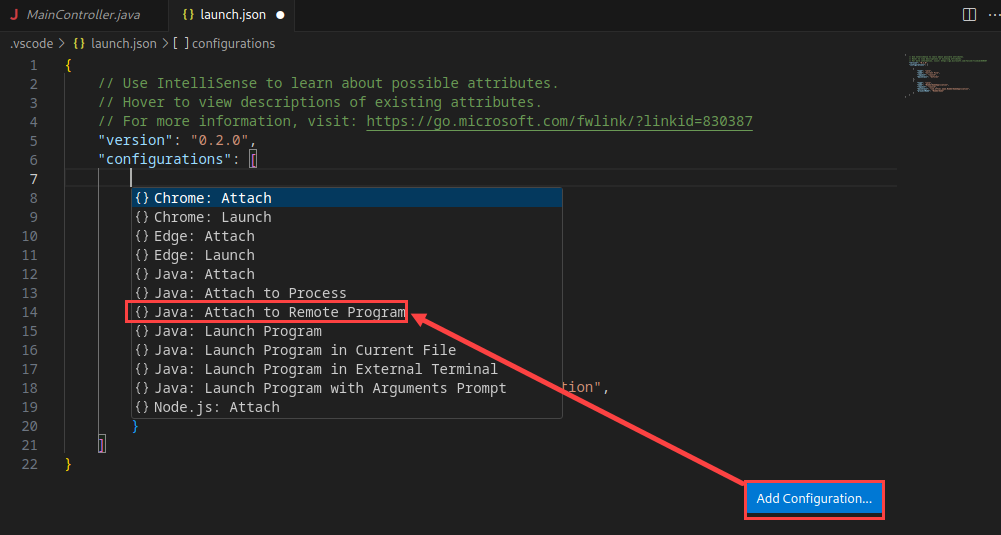
After a few moments, launch.json should open in an Editor window. If the Editor window does not open, we can find the new file in the .vscode directory. We can ignore the default configurations. We will create a new configuration for remote debugging by clicking Add Configuration… and then Java: Attach to Remote Program on the pop-up menu.
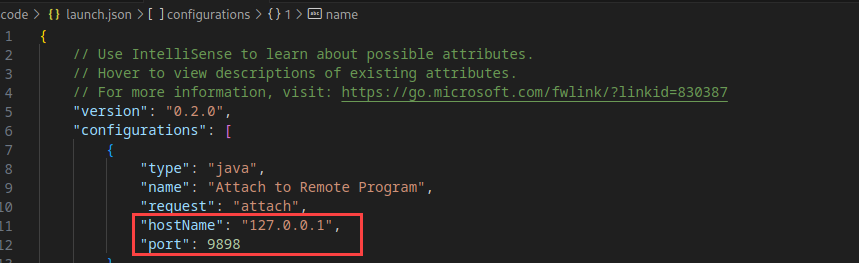
We need to update the “hostName” value to “127.0.0.1” and the “port” value to 9898. We’ll then save the changes.
Now that we have configured launch.json, we can run the JAR file with debugging enabled. We will include the -agentlib:jdwp=transport=dt_socket,server=y,suspend=n,address=9898 flag to enable debugging on port 9898. Since we are only specifying a port number in the address option, the debugger socket will only listen on localhost.
1
2
3
4
5
6
kali@kali:~$ sudo java -agentlib:jdwp=transport=dt_socket,server=y,suspend=n,address=9898 -jar NumberGame.jar
Picked up _JAVA_OPTIONS: -Dawt.useSystemAAFontSettings=on -Dswing.aatext=true
Listening for transport dt_socket at address: 9898
...
2021-03-02 14:14:40.887  INFO 11376 --- [           main] o.s.b.w.embedded.tomcat.TomcatWebServer  : Tomcat started on port(s): 8000 (http) with context path ''
2021-03-02 14:14:40.896  INFO 11376 --- [           main] com.offsec.awae.NumberGameApplication    : Started NumberGameApplication in 2.509 seconds (JVM running for 3.11)
REMEMBER TO RUN THIS COMMAND AS SUDO, OPEN PORTS ON YOUR MACHINE REQUIRES ROOT
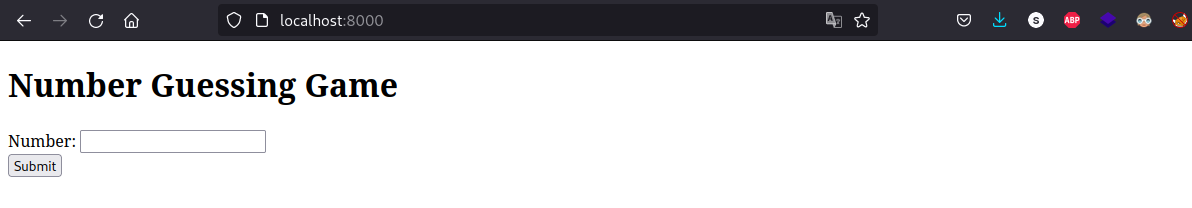
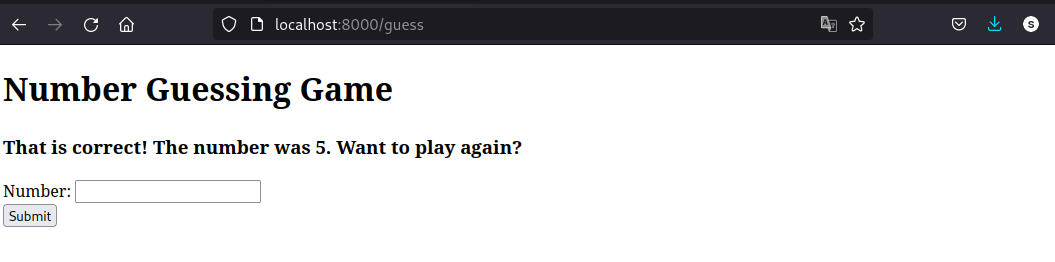
Now that the application has started, we can access it on port 8000 with our browser.
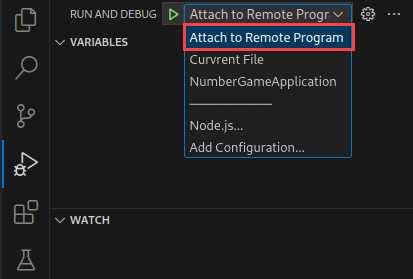
Before we submit a value, let’s start our debugger. In VS Code, we need to click on the Run button if the Run view isn’t still open. Then we will click on the dropdown menu next to the green arrow and click Attach to Remote Program.
Now that we have selected the configuration we want, we can start the debugger by clicking the Start Debugging button (the green arrow).
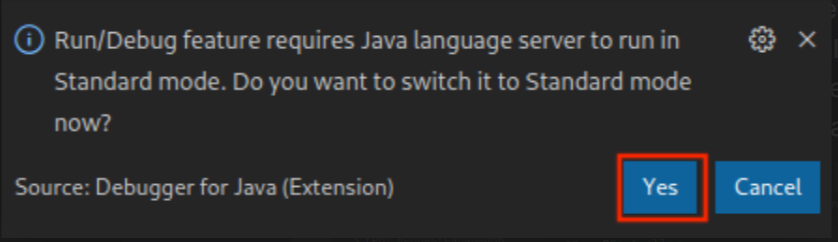
Depending on our configuration, we might receive a pop-up asking for us to switch the Java language server to run in Standard mode. We can click Yes on this pop-up.
Once the debugger has established a connection with the remote program, the debugging context menu should open. We can verify everything is working by submitting a number on the web page and checking if the debugger pauses on our breakpoint.
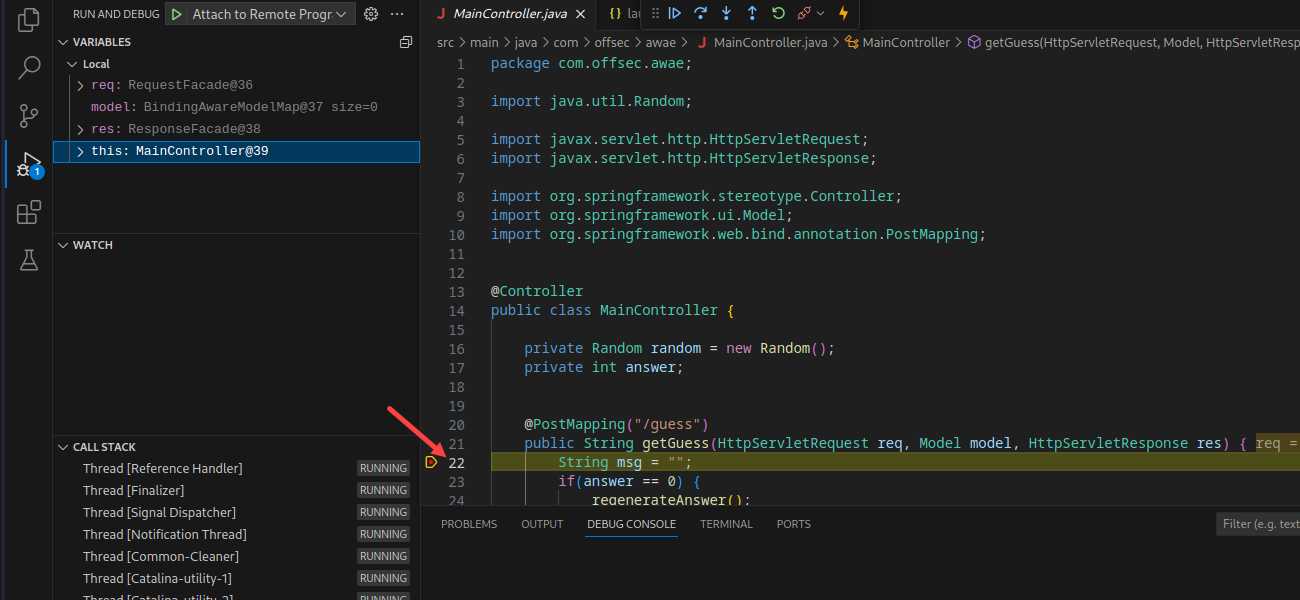
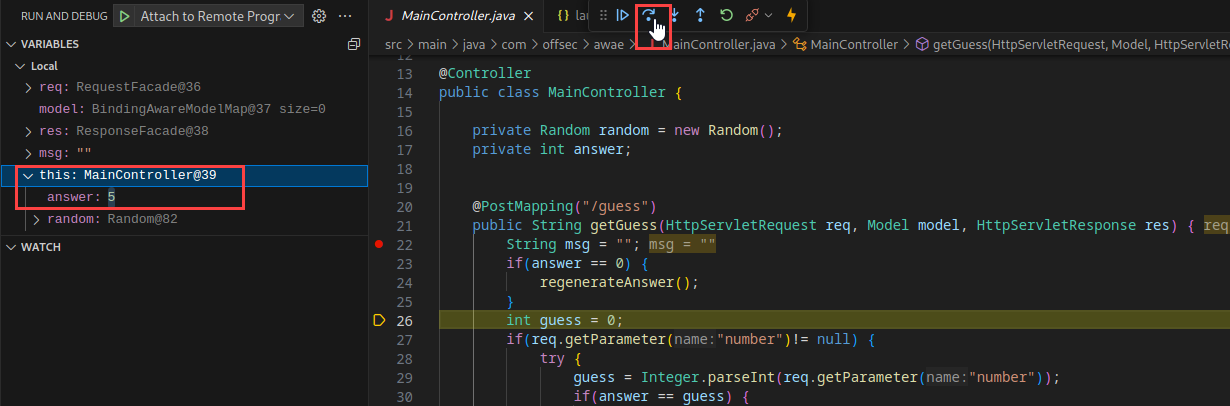
The debugger reached the breakpoint and paused execution. Let’s click Step Over twice to break execution on line 26. We’ll click on this: Main Controller in the Variables window to find the value of the answer variable.
Now that we have the answer, we can click Continue to let execution resume. We can submit another request with the correct answer. When we are finished with the debugger connection, we can click Disconnect. We can then switch to our terminal and press C+c to stop the Java application.
While this application’s functionality is trivial, this exercise demonstrates the value of remote debugging when developing exploits for web applications.