
Debugging
One of the best ways to understand an application is to run it through a debugger, which allows us to inspect application memory and call stacks. This information can be invaluable when crafting an exploit. Some debuggers also support debugging a process running on a remote system. This is known as remote debugging.
Debugging reveals the inner-workings of the application at runtime. To get similar information from databases, we can enable database query logging while we are testing an application. We will use database query logging in other modules.
Let’s try debugging a simple Java application using Visual Studio Code. We will need to install two plugins: the RedHat Language Support for Java and the Microsoft Debugger for Java.
Let’s create a sample Java application that generates a random number and asks us to guess the number. We will create a new directory named debug and create DebuggerTest.java which contains the following code:
1
2
3
4
5
6
7
8
9
10
11
12
13
14
15
16
17
18
19
20
21
22
23
24
25
26
27
28
29
30
31
import java.util.Random;
import java.util.Scanner;

public class DebuggerTest {

  private static Random random = new Random();
  public static void main(String[] args){
    int num = generateRandomNumber();
		Scanner scanner = new Scanner(System.in);
		System.out.println("Guess a number between 1 and 100.");
		try{
      int answer = scanner.nextInt();
      scanner.close();
      System.out.println("Your guess was: " + answer);
      if(answer == num) {
        System.out.println("You are correct!");
      } else {
        System.out.println("Incorrect. The answer was " + num);
      }
    } catch(Exception e) {
      System.out.println("That's not a number.");
    } finally {
      scanner.close();
    }
    System.exit(0);
  }

  public static int generateRandomNumber() {
    return random.nextInt(100)+1;
  }
}
We can debug this application right from our IDE, but first we need to set a breakpoint by clicking to the left of line numbers.
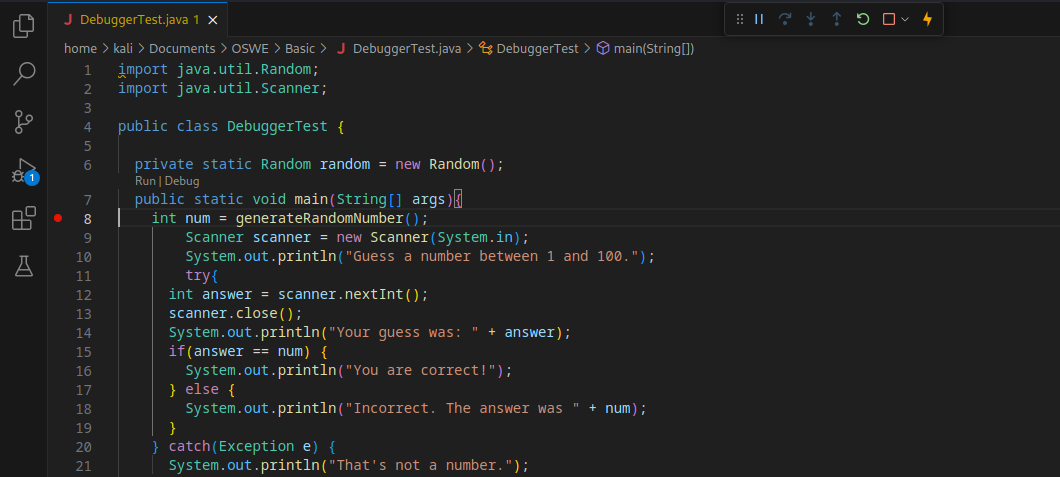
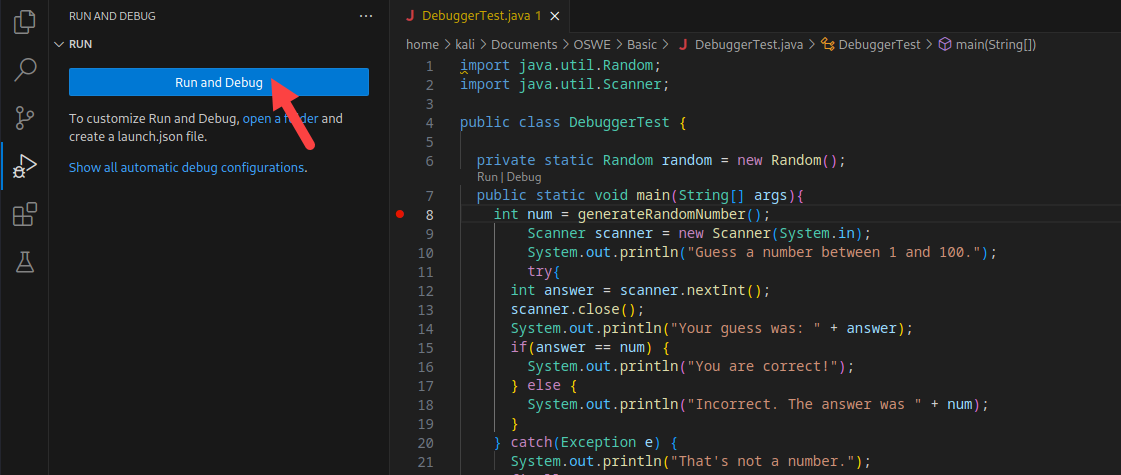
A red dot will appear next to the line number at the location of our breakpoint. Now that we have set a breakpoint, we can debug the application by clicking on Run, then Run and Debug.
The debugger will start running our code until it hits the breakpoint. Once execution reaches the breakpoint, the program will pause, and our IDE will highlight the line where execution paused.
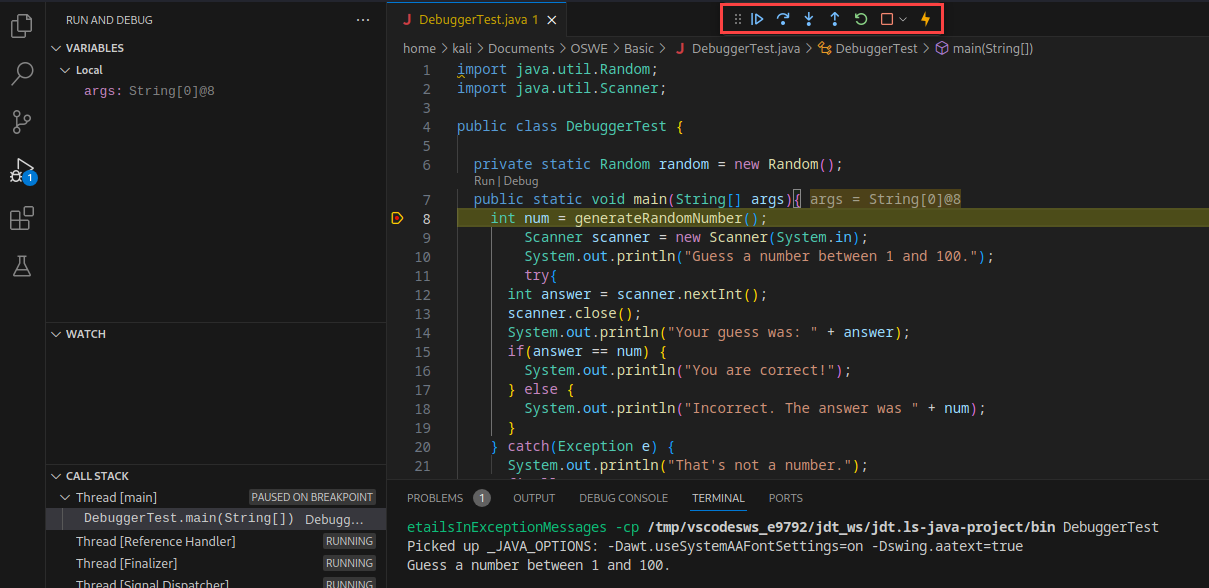
We also have a new debugging context menu. The buttons, from left to right, are Continue, Step Over, Step Into, Step Out, Restart, Stop, and Hot Code Replace. Let’s briefly discuss each of these.
If we click Continue, the application will resume execution until it completes or hits another breakpoint. Step Over allows the next method call to execute and will pause execution at the next line in the current method. In our case, it would execute the call to generateRandomNumber() then pause when execution returns to line 9. Step Into would follow the execution flow into generateRandomNumber() and pause on line 28. Step Out allows the current method to run and then pauses when execution is passed back “one level”. If we pressed Step Out while execution was paused in the main() method, execution would complete. If we pressed it while in the generateRandomNumber() method, execution would return to main() and then pause again. Restart and Stop are self-explanatory.
Hot Code Replace allows us to modify the source file and push changes to the executing process. However, this feature isn’t available in all programming languages.
Let’s click Step Over.
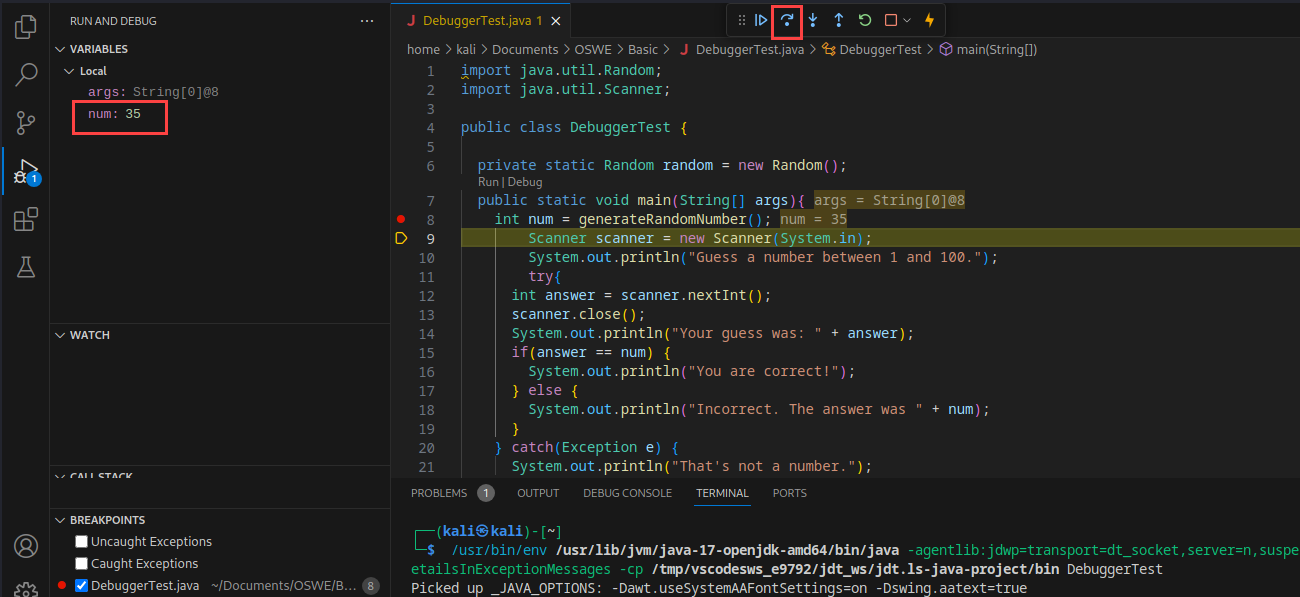
The debugger has now paused execution on line 9 and the Variables window has updated to display the value of the num variable. We can also get the value of a variable by hovering our mouse cursor over it. Let’s click Continue to allow the application to run. We can now “predict” the correct number every time we play this game.